Bartenders manage the flow of beverages behind the bar. But beyond the flair and friendly banter, how much can Bartenders expect to earn?
This article explores the Bartenders wages in United States Of America, exploring the factors that influence your earning potential and offering tips to maximize Bartenders income in this dynamic field.
Defining the Bartenders:
Bartenders are professionals who prepare and serve alcoholic and non-alcoholic beverages to customers in bars, restaurants, hotels, clubs, and other establishments.
Bartenders Salary Range
According to the U.S. Bureau of Labor Statistics1, the annual median salary for Bartenders is $31,510. Bartenders earn salaries ranging from $19,870 to $61,210 annually.
Top 10% earners: Exceed $19,870 annually
Bottom 10% earners: Make less than $61,210 annually
Projected annual median salary for Bartenders in 2024-2025 (with 2.5% increase) is $32,298.
The median annual wages for Bartenders in the Top industries
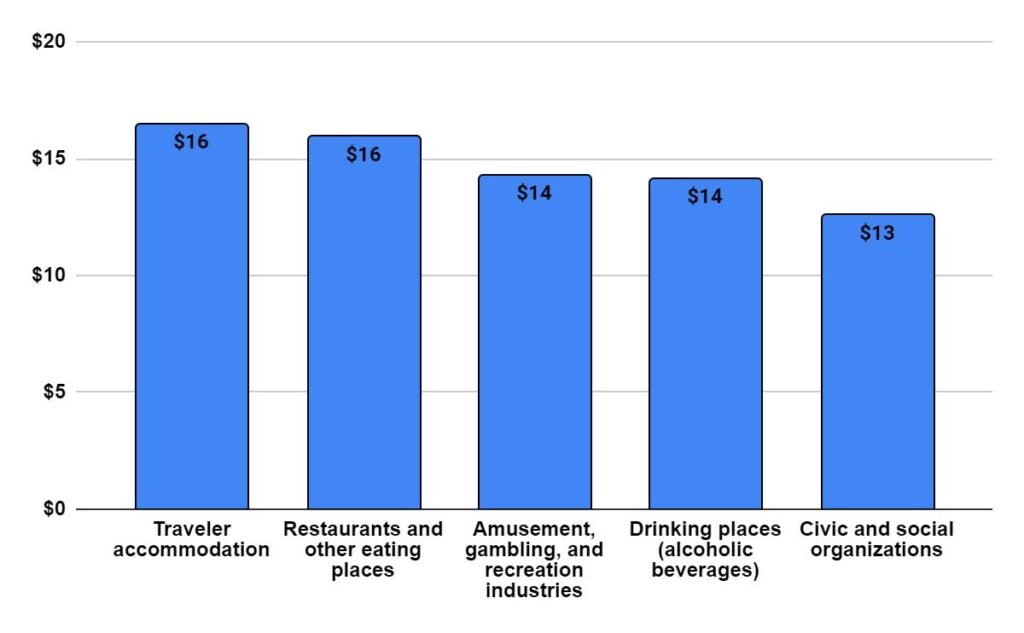
Chart 1: Median annual wages for Bartenders in the top industries (U.S. BLS. May 20232)
This wide range highlights the diverse factors that influence a Bartenders income in USA. We will be discussing those factors below.
Top Paying Industries for Bartenders
The U.S. Bureau of Labor Statistics (BLS) data reveals that Bartenders working for Performing Arts Companies earn the highest annual salaries, exceeding $47,000 annually (U.S BLS May 20233).
Other high-paying industries in USA includes Individual and Family Services and Other Personal Services etc.
| Industry | Hourly mean wage | Annual mean wage |
| Performing Arts Companies | $ 22.84 | $ 47,500 |
| Individual and Family Services | $ 21.25 | $ 44,190 |
| Other Personal Services | $ 21.23 | $ 44,160 |
| General Merchandise Retailers | $ 20.37 | $ 42,370 |
| Promoters of Performing Arts, Sports, and Similar Events | $ 20.00 | $ 41,590 |
Industry with highest Employment Level for Bartenders
Most number of Bartenders are employed in Credit Intermediation and Related Activities, followed by Securities and Other Financial Investments Related Activities.
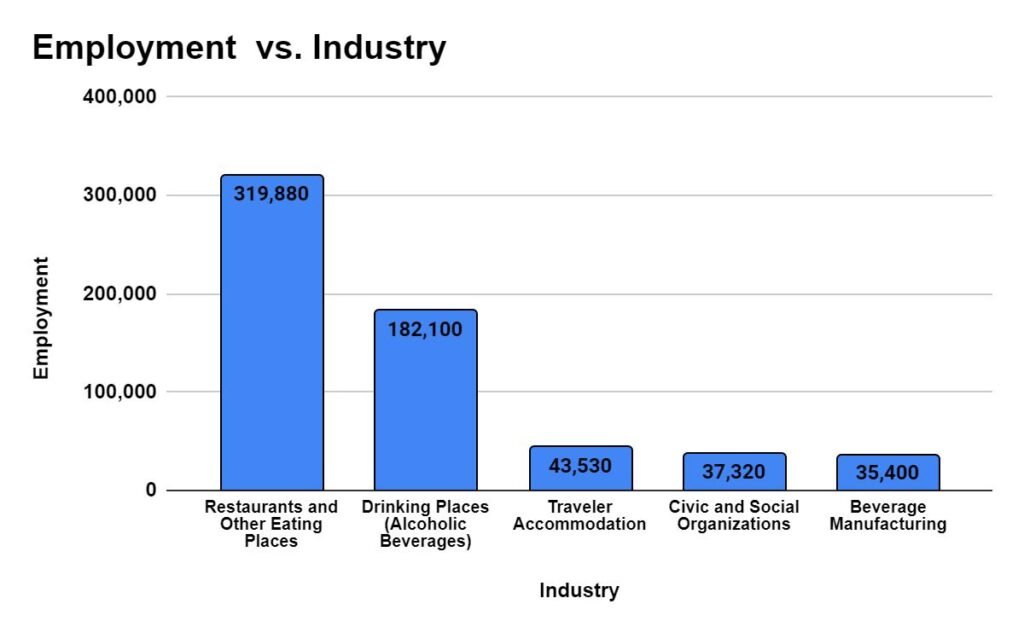
Chart 2: Industry with highest employment level for Bartenders
Top Paying U.S. States for Bartenders
District of Columbia leads the pack with the highest annual mean wage for Bartenders in USA. Following closely are Washington and New York all offering wages exceeding $59,000 annually (U.S BLS4).
| State | Hourly mean wage | Annual mean wage |
| District of Columbia | $ 28.78 | $ 59,850 |
| Washington | $ 27.74 | $ 57,710 |
| New York | $ 26.99 | $ 56,140 |
| Hawaii | $ 25.07 | $ 52,140 |
| Arizona | $ 24.46 | $ 50,870 |
Click Here To View Wages of All States U.S. States with the highest employment level for Bartenders California leads in providing employment to the Bartenders, followed by Texas and Florida. Chart 3: States with the highest employment level for Bartenders After factoring in federal and state taxes, a Bartenders with a state-wise annual mean salary, would have an estimated net income as follows: Taxes and take home pay estimate for a single filer New-York: $56,140 (Annual mean wage) – $7,457 (Estimated income tax) = $48,683 (Estimated take home pay). California: $41,150 (Annual mean wage) –$3,908 (Estimated income tax) = $37,242 (Estimated take home pay). Texas: $33,990 (Annual mean wage) – $2,197 (Estimated income tax) = $31,793 (Estimated take home pay). More taxes can be saved by contributions in IRA, retirement, itemized deduction such as charitable contributions, medical and dental expenses. Total compensation for Bartenders goes beyond the hourly or annual wage. Organizations offer additional benefits such as: Tips: Often the most significant source of additional income. Meal stipends: Free or discounted food during work hours. Employee discounts: On food, drinks, or merchandise. Health insurance: Comprehensive health insurance coverage for you and your dependents. Paid time off: Vacation days and sick leave. Performance bonuses: Based on sales or customer feedback. Uniform allowance: Reimbursement for required work attire. Continuing education reimbursement: Support for professional development and training. Retirement savings plans: Retirement planning gets a helping hand with employer-sponsored plans like 401(k)s. These plans offer tax advantages for saving. Employers may also match employee contributions. Several factors can affect Bartenders paycheck: Experience: As with most professions, experience plays a significant role in determining salary. Bartenders specialists can expect lower salaries, while seasoned professionals with proven track records command higher compensation. Location: Geographic location significantly impacts Bartenders salaries. U.S. States like District of Columbia, Washington, and New York offer some of the highest pay, while others may offer lower wages. Industry: The industry you work in can impact your salary. Performing Arts Companies generally offer the highest wages. Employer: Working for a High-end cocktail bars or nightclubs might offer higher compensation packages compared to casual sports bars or pubs. Scheduling: Bartenders often work evenings, weekends, and holidays. While these hours can offer flexibility, they can also impact potential earnings compared to a traditional 9-to-5 job. Tips: A significant portion of a bartender’s income comes from tips left by patrons. The amount of tips can vary greatly depending on the clientele, bar atmosphere, and the bartender’s skill in creating a positive experience. Contract Details: The specific terms of the employment contract, including factors like housing stipends, overtime pay, and benefits, can affect the overall compensation package. So, how can Bartenders maximize their salary? Here are some tips: Skills and Certifications: Developing advanced skills like mixology or flair bartending can increase your value and potentially lead to higher-paying opportunities. Master the Craft: Learn about different types of liquor, cocktails, and proper bartending techniques. Strong knowledge and efficient drink preparation are essential. Negotiate Your Salary: Don’t be afraid to negotiate your salary during the job offer stage. Research market rates for Bartenders with your experience and qualifications. Develop Customer Service Skills: Being friendly, attentive, and able to create a welcoming atmosphere for patrons is crucial for building rapport and encouraging tipping. Network Within the Industry: Build relationships with other bartenders, bar managers, and industry professionals to learn about potential job openings. Conclusion: A career as a Bartenders in United States offers both professional satisfaction and the potential for a high salary. By understanding the various factors that influence salary and carefully managing expenses, Bartenders can make informed decisions and pave the way for a rewarding and financially secure career path. Share this Post Note: This article provides general information only and should not be considered financial advice: Your individual circumstances and specific job offer details will significantly impact your actual earnings. Seek professional guidance: Consulting with a financial advisor can provide personalized advice on managing your finances and maximizing your savings potential. ResourcesStates name Employment Hourly mean wage Annual mean wage Alabama (al) 4870 12.75 26520 Alaska (ak) 1730 14.56 30290 Arizona (az) 13330 24.46 50870 Arkansas (ar) 2460 16.78 34890 California (ca) 77230 19.78 41150 Colorado (co) 16960 19.61 40800 Connecticut (ct) 8450 20.06 41730 Delaware (de) 2110 17.64 36700 District of Columbia (dc) 3740 28.78 59850 Florida (fl) 57400 18.37 38220 Georgia (ga) 13710 15.23 31680 Guam (gu) 210 10.79 22450 Hawaii (hi) 3500 25.07 52140 Idaho (id) 3410 13.58 28240 Illinois (il) 33730 16.83 35000 Indiana (in) 12750 12.64 26300 Iowa (ia) 9400 12.40 25790 Kansas (ks) 5380 15.07 31350 Kentucky (ky) 5320 15.93 33140 Louisiana (la) 9260 12.16 25280 Maine (me) 2740 22.31 46410 Maryland (md) 11490 19.24 40020 Massachusetts (ma) 19920 18.92 39350 Michigan (mi) 18200 17.72 36860 Minnesota (mn) 20170 13.36 27800 Mississippi (ms) 3290 15.21 31630 Missouri (mo) 16730 17.12 35600 Montana (mt) 5430 11.87 24680 Nebraska (ne) 5610 15.76 32780 Nevada (nv) 15730 15.79 32850 New Hampshire (nh) 3620 17.12 35610 New Jersey (nj) 16900 22.91 47660 New Mexico (nm) 2830 17.67 36750 New York (ny) 35100 26.99 56140 North Carolina (nc) 17220 18.73 38960 North Dakota (nd) 4370 15.13 31460 Ohio (oh) 25190 16.57 34470 Oklahoma (ok) 6780 12.34 25670 Oregon (or) 10940 16.81 34950 Pennsylvania (pa) 33320 13.96 29030 Puerto Rico (pr) 2760 10.65 22150 Rhode Island (ri) 3280 18.38 38230 South Carolina (sc) 10410 11.53 23970 South Dakota (sd) 3700 14.09 29310 Tennessee (tn) 10730 13.85 28810 Texas (tx) 57660 16.34 33990 Utah (ut) 3180 18.06 37560 Vermont (vt) 2140 23.82 49540 Virgin Islands (vi) 520 24.24 50430 Virginia (va) 11570 22.46 46730 Washington (wa) 15730 27.74 57710 West Virginia (wv) 2610 16.19 33660 Wisconsin (wi) 27660 12.92 26880 Wyoming (wy) 2110 13.22 27500 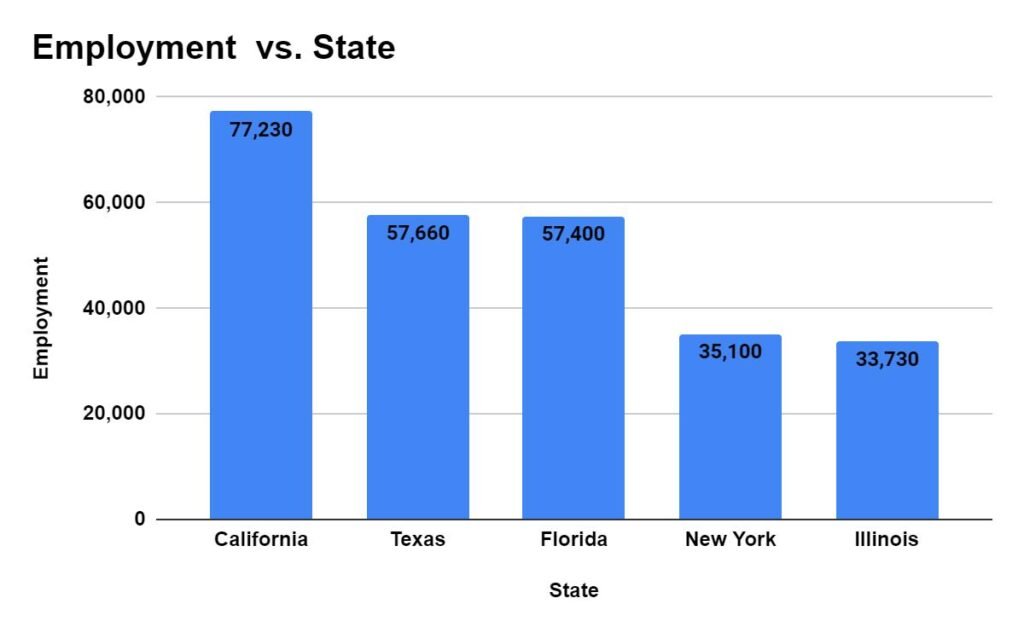
Bartenders Take-Home Pay
Beyond the Base Salary
Factors Affecting Bartenders Income
Boosting Bartenders Salary: Skills and Tips
